FDE salary: tiers and data (with sources)
TL;DR
FDE (Forward Deployed Engineer) pay at frontier labs has reached seven-figure USD total comp, with equity a rising share; at top Chinese tech firms, FDE / forward-deployment roles land roughly ¥300K–¥1.05M per year. This page breaks FDE salary down by level, base pay, and company type. Every figure below cites its source and date.
Demand side: why FDE pay is climbing
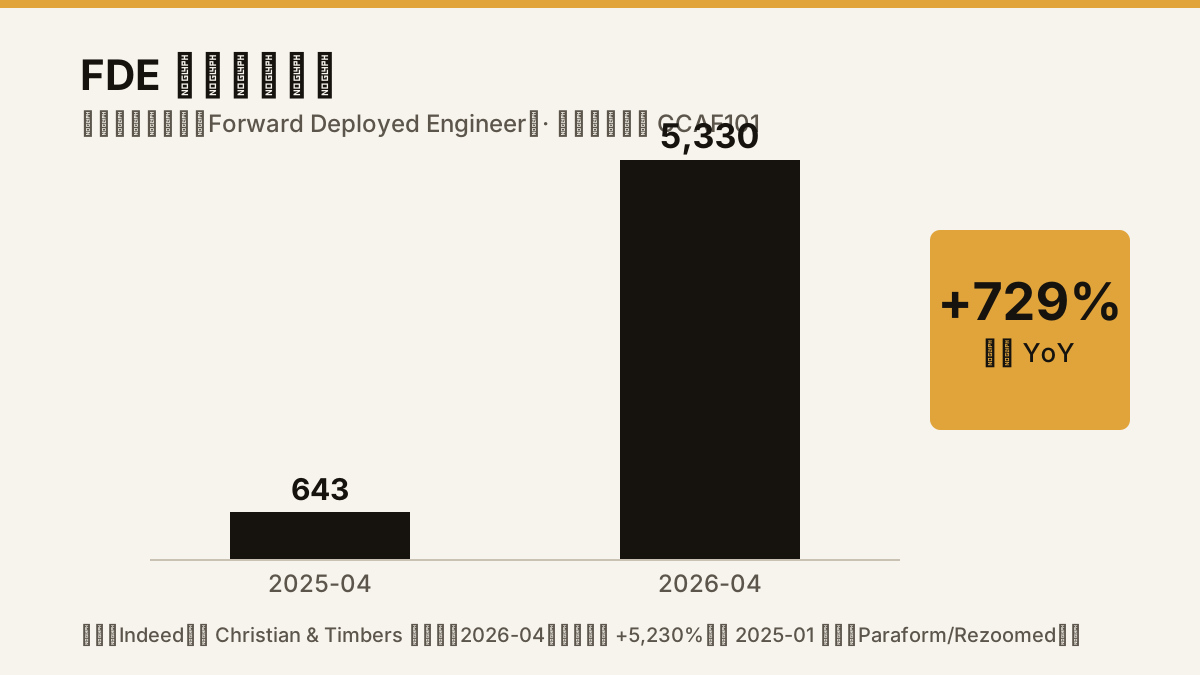
Pay shadows demand. FDE job postings grew from 643 (2025-04) to 5,330 (2026-04), +729% YoY (Indeed via Christian & Timbers, 2026-04); measured against a 2025-01 baseline the cumulative growth is +5,230% (Paraform / Rezoomed, 2026-04, same-source conversion of the +729%). Buyers are doubling down too: OpenAI announced its Deployment Company on 2026-05-11 ($4B+ initial funding, acquiring Tomoro with ~150 FDEs), AWS committed $1B on 2026-06-30 to build its own FDE org starting at "thousands" of engineers (TechCrunch / CNBC, 2026-06-30), and Google Cloud announced hundreds of FDE hires in May 2026. Supply lagging demand is the direct backdrop to this round of FDE pay inflation.
Overseas tiers (USD total comp)
| Mid | $385K–$510K | Perspective AI 2026 FDE Compensation Report (1,200 sample), 2026-05-21 |
|---|---|---|
| Senior | $560K–$785K | Perspective AI, 2026-05-21 |
| Staff | $750K–$1.0M | Perspective AI, 2026-05-21 |
| Principal | $1.2M+ | Perspective AI, 2026-05-21 |
| US median | ~$215K (FDSE) | levels.fyi FDSE, 2026 |
Base pay and named data points
The table above is total comp. On base salary alone, frontier labs are close together: Anthropic mid $220K / senior $275K / staff $310K–340K; OpenAI mid $230K / senior $290K / staff $330K–370K; Palantir FDSE mid base is $145K–175K (Perspective AI, 2026-05-21). For named data points, the same report puts Anthropic L4 average total comp at $665K and OpenAI L5–L6 at $700K–$1.28M (Perspective AI, 2026-05-21). In other words, FDE pay diverges mostly outside base salary — in equity. See "What drives the number" below. For a cloud-vendor baseline, Google Cloud FDE II base pay is $127K–$183K plus bonus and equity (Google Careers / Metaintro, 2026-05). Besides levels.fyi's ~$215K (FDSE), an Exponent estimate puts the US median at ~$174K — both are listed for cross-reference (2026).
By company type: same level, three bands
At the Senior level, FDE pay splits into three bands by company type: frontier labs > Applied-AI startups > Fortune 500 enterprises, with Palantir listed for reference (Perspective AI, 2026-05-21):
| Frontier labs | $560K–$785K (Senior) | Perspective AI, 2026-05-21 |
|---|---|---|
| Applied-AI startups | $340K–$470K (Senior) | Perspective AI, 2026-05-21 |
| Fortune 500 | $240K–$310K (Senior) | Perspective AI, 2026-05-21 |
| Palantir (reference) | $280K–$340K (Senior) | Perspective AI, 2026-05-21 |
China figures (annual)
Chinese tech firms still quote FDE pay as "monthly salary × number of months", and the multiplier varies (13 / 15 / 16); normalize the basis before comparing annual packages:
| ByteDance · Doubao | ¥35K–70K/mo × 15 (top ~¥1.05M/yr) | Securities Times (stcn) / 36Kr, 2026 |
|---|---|---|
| Alibaba Cloud | ¥20K–50K/mo × 16 | Securities Times (stcn), 2026 |
| Tencent Cloud | ¥35K–65K/mo × 15 | research-trend §1.3, 2026-07-14 |
| Microsoft (L64 band) | $156.5K–$234.7K (~¥1.06M–1.6M), up to ¥2M+ with stock and bonus | Sina, on Microsoft FDE pay, 2026 |
Note: this page only lists FDE salary data points traceable to a named source and date. A few second-hand figures for Chinese vendors could not be traced to a primary source this round and are omitted per our no-unverified-figures rule (pending verification). If you see figures elsewhere that differ a lot from this page, it is usually a basis mismatch — total comp vs base, with or without equity, 13/15/16-month conversion — align the basis before drawing conclusions.
What drives the number
Level (mid / senior / staff / principal), company type (frontier labs > Applied-AI startups > Fortune 500), equity share, and whether you can own production outcomes. Equity is what actually separates the bands: its share of total comp rose from 35–45% (2024) to 55–70% (2026), and frontier labs pay roughly 2.0–3.5x Palantir at the same level, with nearly the entire gap coming from equity (Perspective AI, 2026-05-21).
How to read this page
Three rules of thumb. First, banded ranges beat single data points: the same level can differ by more than 2x across company types (see the table above), so know which band an offer sits in before negotiating. Second, total comp is not cash: the higher the equity share, the more the headline number swings with the market — compare base and equity separately. Third, this market moves fast: every range here is a time-stamped data point, not a promise; each cites its source and date, and you should re-check the original source before citing.
← Back to the FDE career overview
CCAF101 is an independent, unofficial CCAF / CCA-F study resource, with no affiliation to Anthropic. Salary figures are public data points that fluctuate; each cites its source and date, and unverified figures are omitted.